Simplifying Complex Brands with Infographics
We’re in the information age. With a few keystrokes or a voice search, practically anyone can find mountains of information—more than they could ever use or benefit from. Meanwhile, companies are looking for compelling ways to connect with their audiences using data, without causing information overload.
So what’s a brand to do? Ask any marketer if they’d prefer a complicated brand message or a simple one, and they’ll all say the same thing. Simple, straightforward brand messaging that leads to better comprehension and recall is always ideal.
It’s not always an easy task, but infographics can help get the job done.
Easy on the eyes.
Sometimes the hardest part of marketing is explaining what a company does. A few years ago our team worked with The Donald Danforth Plant Science Center to share its mission and impact. The company works with complex scientific concepts and needed a way to explain its work to laypeople. Enter infographics.
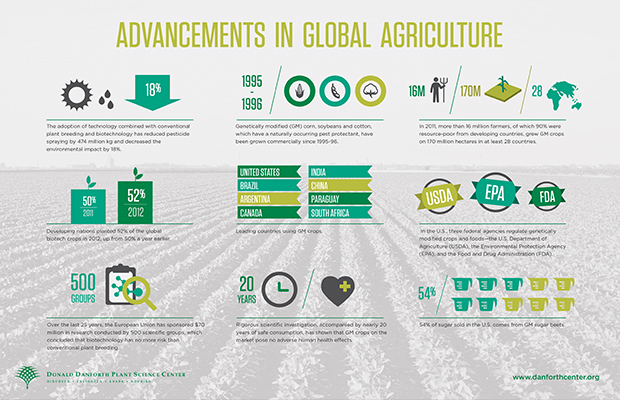
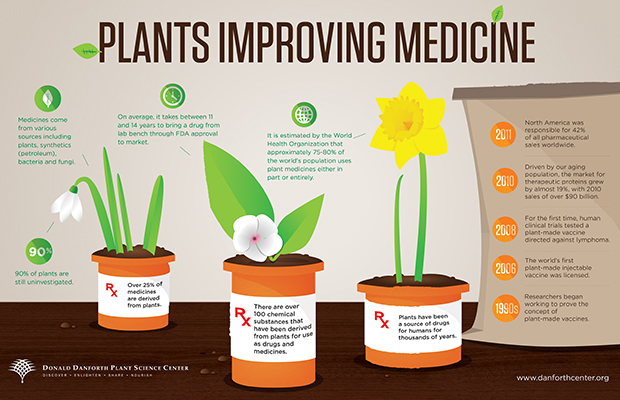
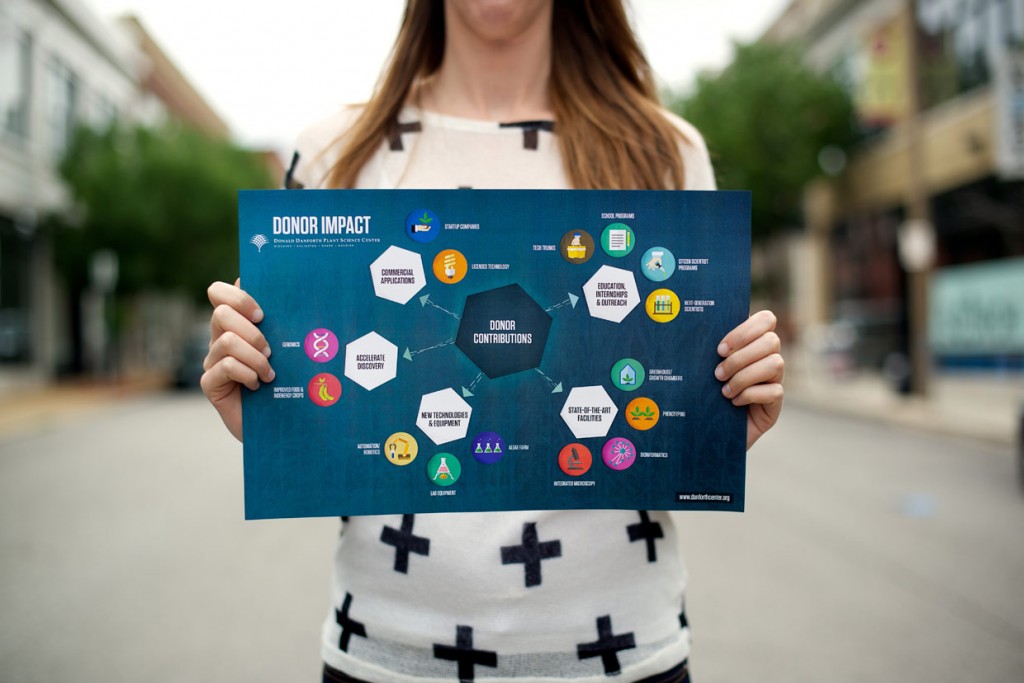
Visual interpretations of data—when done correctly—can be more compelling and easier to ingest than a long-form article or endless tables of numbers. Stat after stat show that people take in information faster when it’s presented visually, and they’ll spend more time looking at something that’s appealing than something that makes their eyes glaze over. So we used simplified, focused and well-organized images to make the Danforth Center’s work understandable and even inviting for supporters and donors.
Brand story time.
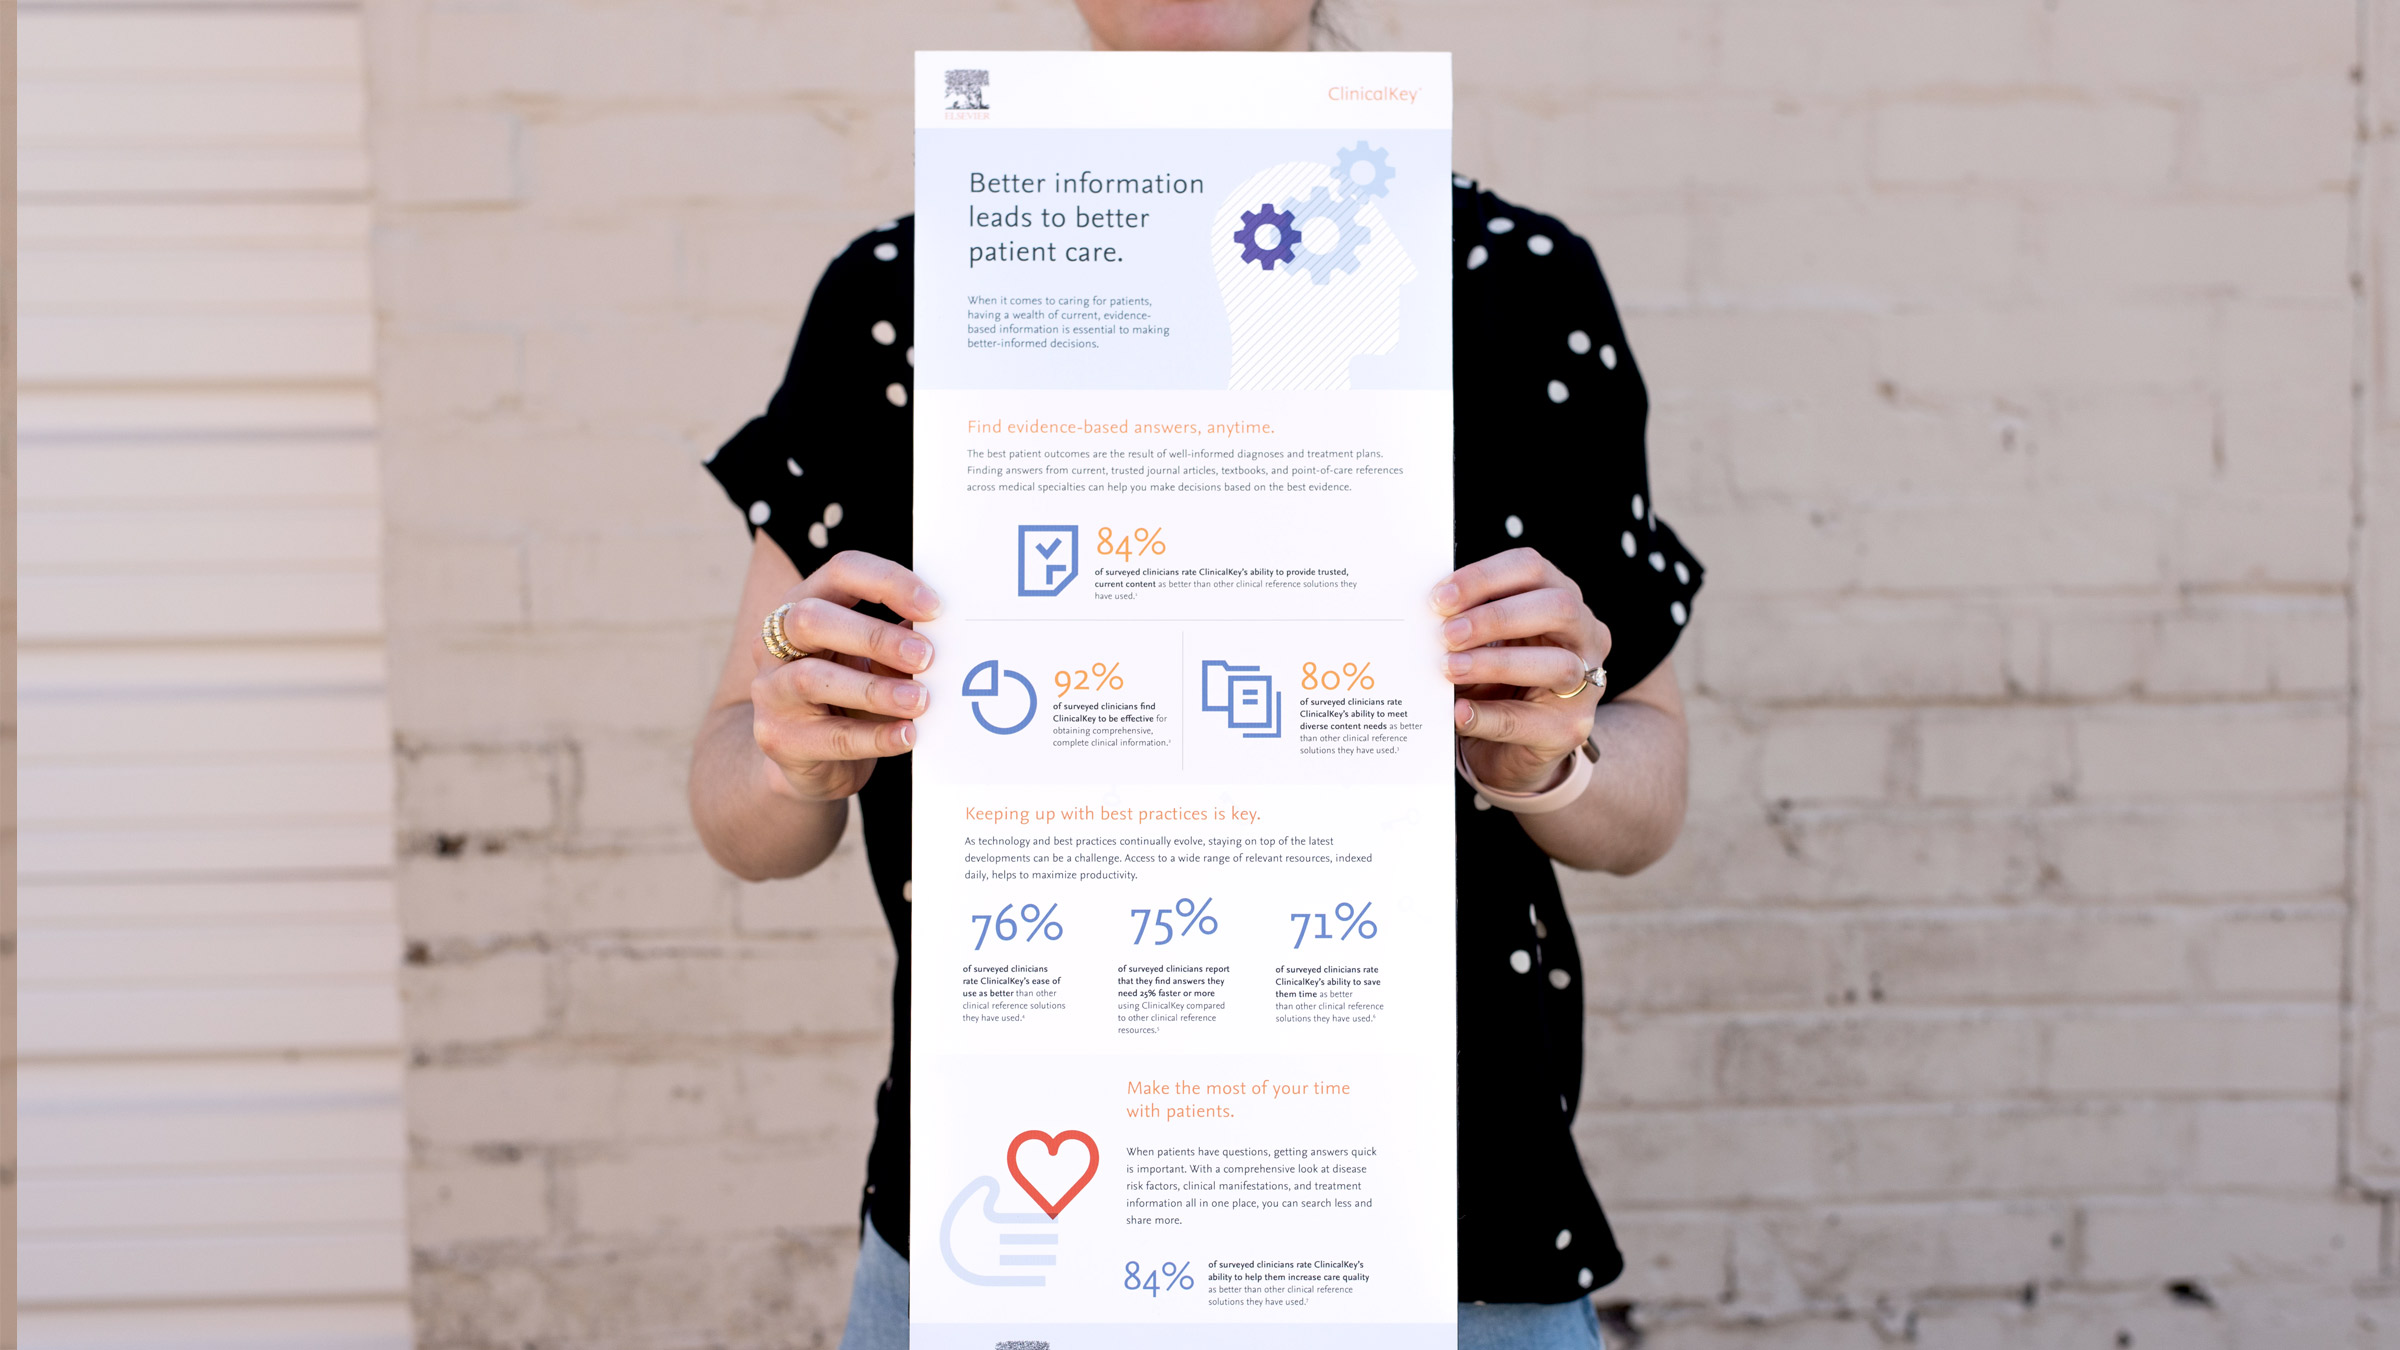
Our client Elsevier understands the importance of data—and the intimidation factor of data overload. Elsevier’s product, ClinicalKey, allows physicians and medical librarians to easily search for information they need to make smart—and speedy—decisions on patient care. Instead of slogging through page after page or volume after volume of information, subscribers can do a simple search to find what they need.
Elsevier had data about their data. To a lot of people, that might sound excruciatingly boring. But used correctly, the stats could show decision-makers how ClinicalKey is different, and better, than other solutions. An infographic made it all interesting, and far more compelling than a standard sales pitch.

The resulting infographic immediately conveys how useful ClinicalKey is and communicates the intended message—if a medical professional wants a dependable, easy-to-use resource to guide patient care, ClinicalKey is the answer.
Establish expertise.
In addition to simplifying big concepts and extracting the most important information, infographics can help brands simultaneously establish themselves as experts and educate their audience.

Check out this infographic we created for ClinicalKey to build up the product as a wealth of knowledge. The infographic educates clinicians about the symptoms, treatment and prevention of Lyme disease from tick bites, but more importantly, acts as evidence of the company’s commitment to high-quality, easily accessible data. It’s enticing to the eye (or as much as something with illustrations of ticks on it can be), easy to read and doesn’t waste the reader’s time—exactly what ClinicalKey offers to clients.
The gift that keeps on giving.
In addition to using infographics to simplify loads of data or complex messages, they’re also economical: you can take the bones of an infographic and make tons of other content. Add some basic animation and code to make an interactive page on your website where visitors can experience your brand story by clicking and hovering. Share whole infographics on social media, or even break up a single infographic into several bite-sized pieces to share one at a time.
Infographics add extra dimension to blog posts or articles. A study by BuzzSumo and OkDork looked at more than 100 million articles and found that internet users are more likely to share infographics than any other type of content.
The right tool for the job.
Shareability aside, infographics are a valuable tool for turning mountains of information—or just complex information itself—into brand differentiators. Turning a lead into a client isn’t about overloading them with as much information as possible but sharing the right information in a way they’ll understand and appreciate. And in the information age, for companies across industries, infographics are often the way.
Let’s stay in touch! Keep up with the latest from Atomicdust.
Subscribe to our email list for all the latest news, events and monthly marketing tips from our team.
